 Tatiana Losev
Tatiana Losev Ph.D. Data Visualization
I help visualize data for social connection and shared understanding
I design visual, hands-on ways for communities, scientists, and decision-makers to explore data — from public health dashboards to community sculptures built from yarn and open statistics. Based in Calgary & Vancouver, Canada.
Open to research collaborations and consulting work.
About me
Working across sectors & communities
I bring multiple perspectives into how data are shown and used by working with people in the public outside university campuses, scientists, policymakers, nurses, public health teams, health economists, teachers, engineers in the energy-sector, and academic colleagues.
I earned my Ph.D. at Simon Fraser University's School of Interactive Arts & Technology, supervised by Dr. Sheelagh Carpendale. I'm part of ixLab and InnoVis, and a visitor at the iLab and the Pain Studies Lab.
Research
What I work on
The problem
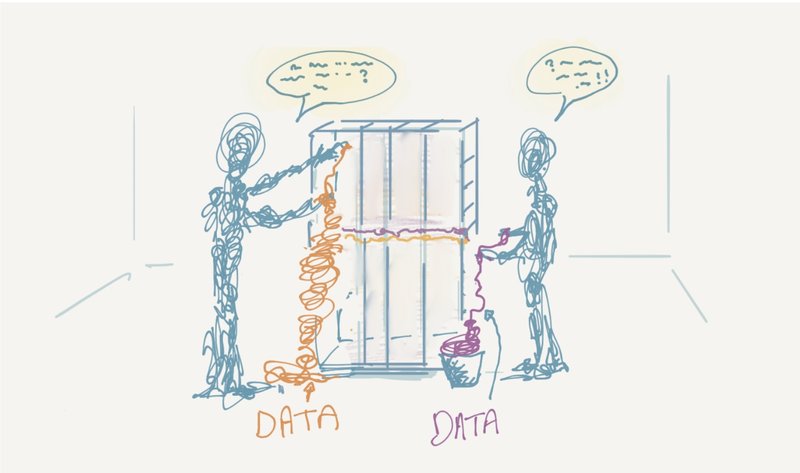
Charts and dashboards are usually made for people, not with them. During COVID-19, and now through the climate crisis, we keep seeing the same pattern: experts deliver data, and often audiences disengage or mistrust data.
My approach
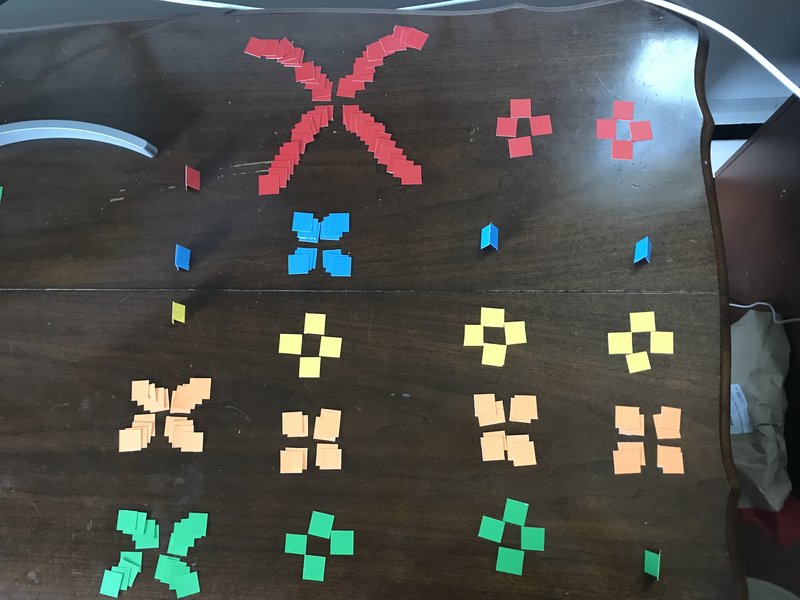
I work with people to make visualizations — on screens, on paper, and in physical materials. This last approach, data physicalization, treats data as something you can pick up and turn over like a sculpture, a textile, a built object.
What this has looked like in practice
- Public health (2020): Co-designed and built early COVID-19 data visualizations used by public health authorities and researchers — informing decision-making during a critical public health emergency.
- A community on Vancouver Island (2022): Visitors to an arts centre built a yarn sculpture from national statistics about trust in COVID-19 information.
- Best Paper, CHI (2024): Our work on sustainable data physicalization practices won Best Paper at the leading global conference on how people interact with technology.
My questions
- What is it like for researchers and members of the public to learn from each other by exploring data together?
- How does someone feel connected to, and supported by, their community through interactions with data?
- What would data visualizations look like if they were designed for emotions like feeling of interdependence, sense of togetherness or belonging, not only facts?
What would data visualizations look like if they were designed for emotions like feeling of interdependence, sense of togetherness or belonging, not only facts?
Work with me
Bring me in when…
- You need to communicate complex data to a community, board, or public audience and the usual chart-on-a-slide isn't landing.
- You're a policymaker or public-sector team translating health, climate, or social data into something a non-specialist audience can actually use and trust.
- You're an industry team working through a system or UX problem — internal tools, data interfaces, decision-support dashboards — and want a researcher's eye on how it's being received.
- You're running a participatory project and want data to be something people make together, not something they're shown.
I take on research collaborations, creative workshops, system-level and corporate program evaluations, system-design workshops, UX research, and bespoke commissions. Recent partners include public health teams, university institutes, arts centres, and corporate data teams.
Collaborations
Projects with communities & colleagues
2026
-
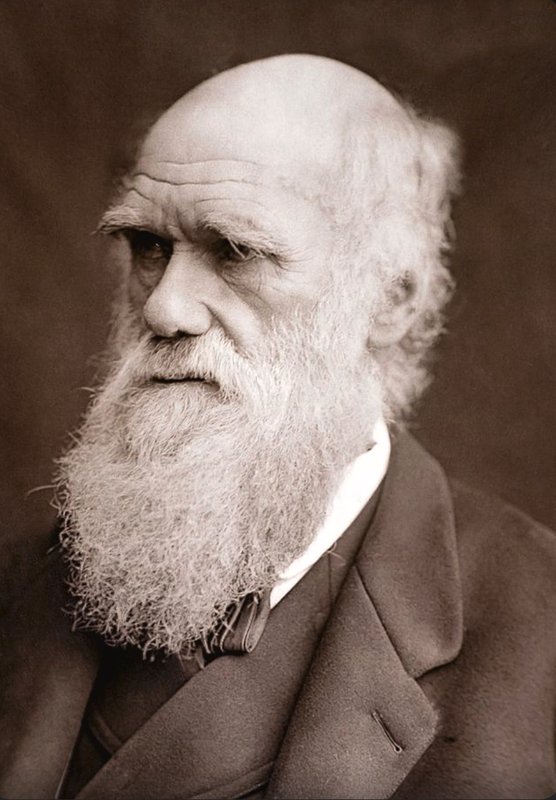
Interactive Touch Table Visualization: Darwin and the Development of Natural Selection
In collaboration with the curators at the Taylor Family Digital Library, I'm helping design an interactive touch table visualization that enhances the exhibition experience. Alongside the historical artifacts, the visualization reveals the people, ideas, and relationships that influenced Charles Darwin's development of natural selection and evolution.
-
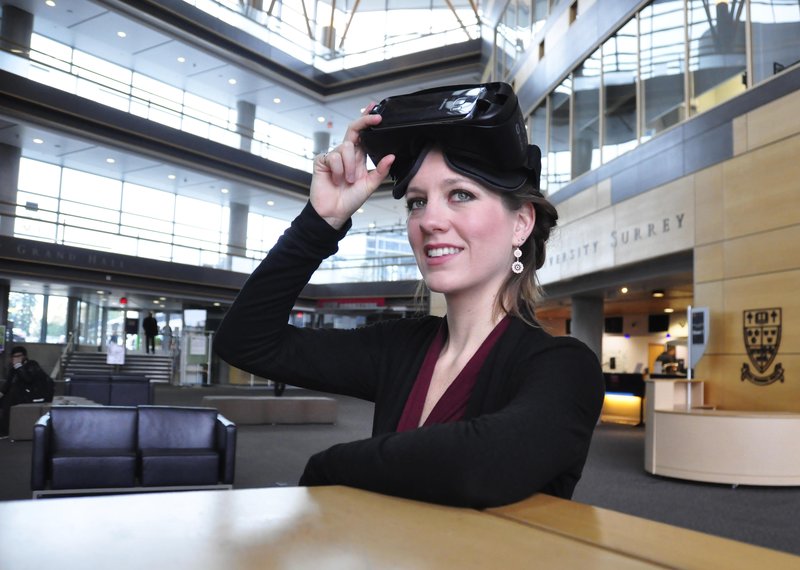
Community Health: Compassion-Based Co-Design in Virtual Reality
A community-health partnership with Vancouver Children's Hospital, emerging adults living with chronic health conditions, and Simon Fraser University — a multidisciplinary team spanning cognitive science, psychology, neuroscience, health sciences, computer science, VR design research, and data visualization.
2024–25
-
Community Data Explorations
A collaboration with community leaders, researchers, designers, and local artists exploring the intersection of data, art, and research, in partnership with Creative Coast Arts + Culture Powerhouse.
Show all collaborationsShow fewer
-
Health Data & the Public
A cross-disciplinary research exploration with international researchers in infectious diseases, data analytics, and data visualization that began at Dagstuhl.
2023
-
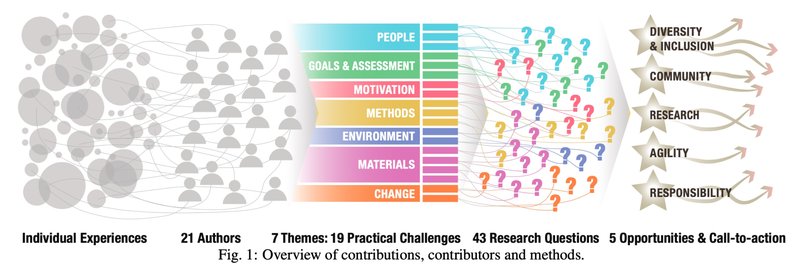
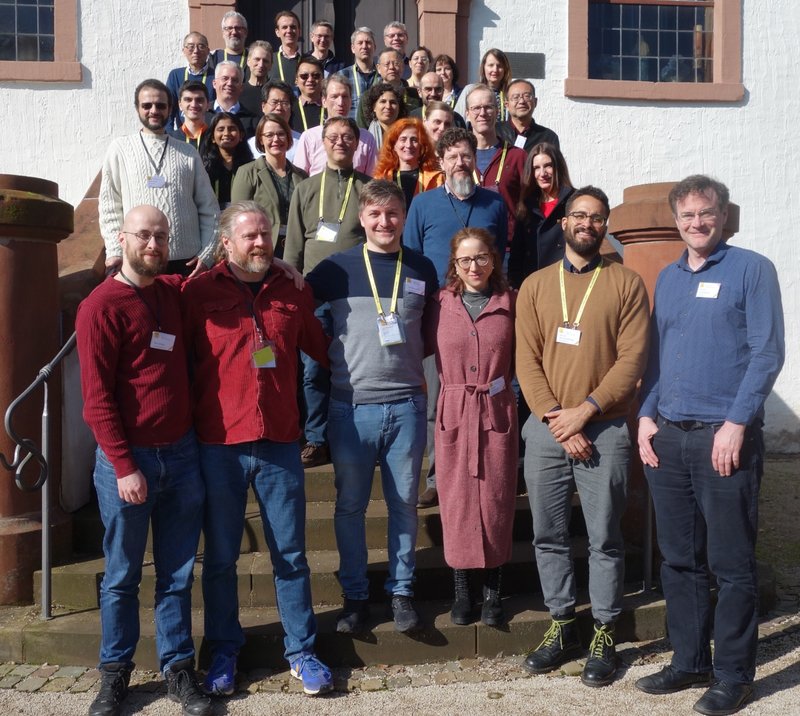
Challenges and Opportunities in Data Visualization Education: A Call to Action
Working with 21 researchers and instructors from design, engineering, art, and computing sciences calling for a venue to share teaching and learning practices in information visualization. This led to a published full paper and the EduVIS workshop at IEEE VIS.
-
Re-Contextualizing Built Environments: Critical & Inclusive HCI Approaches for Cultural Heritage
Co-organized a workshop to identify approaches that support critical discourse and increase inclusiveness in computer-mediated interactions between people and cultural heritage.
-
Case Study on Organizational Responsiveness During COVID-19
We explored people's experiences and perceptions of organizational responsiveness during the COVID-19 pandemic.
-
Slow Data in Healthcare with Data Physicalization
"Data as a Material for Design" — a multidisciplinary collaboration exploring how we can slow down people's interactions with data in healthcare settings and use physical materials to represent these data.
2022
-
Data Visualization for Teaching, Learning and Empowerment
A week-long research seminar collaborating with 25 international researchers in data visualization and HCI at Germany's research centre for computer science and informatics.
-
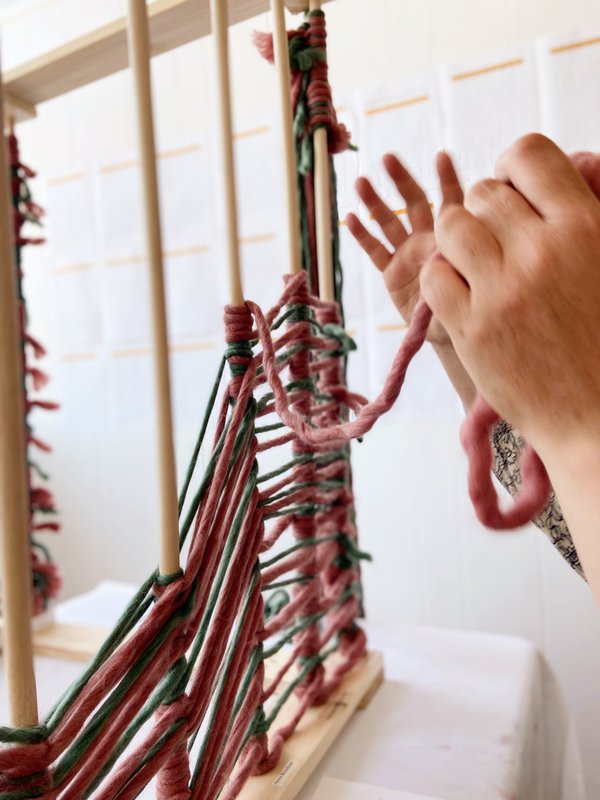
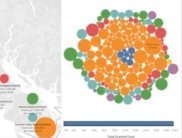
"Wound Up in a Pandemic": a Community-Built Data Physicalization on Trust in COVID-19 Information Sources
In collaboration with the TOSH community arts centre on Vancouver Island and its visitors, we physicalized questions and open data from Statistics Canada about trust in COVID-19 information — built by people in the community.
-
Embracing Disciplinary Diversity in Visualization
Data visualization is a cross-disciplinary practice. I was part of a 2-day research workshop on cross-disciplinary perspectives and approaches in data visualization.
2020
-
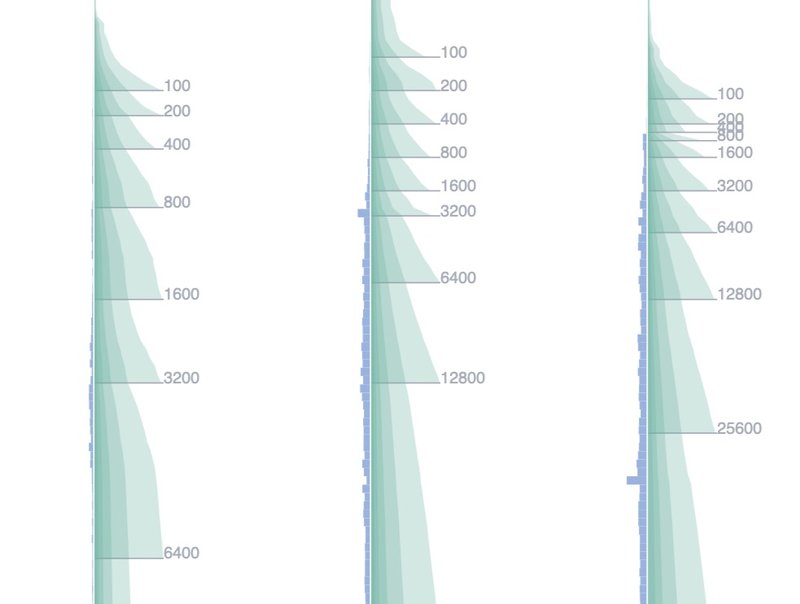
Visualizing COVID-19 Data at the Onset of the Pandemic
Part of a team of designers, health researchers, and computer scientists visualizing emergent COVID-19 data for public health authorities and researchers — critical to decision-making about public health interventions at the time. Design details & collaborators.
2017–2019
-
Experiential Learning in Higher Education: The College of Discovery, Creativity, and Innovation
Worked with an incredible team of researchers and organizers in experiential learning theory and practice — community-oriented discussions, communities of practice for instructors, and partnerships with community leaders.
-
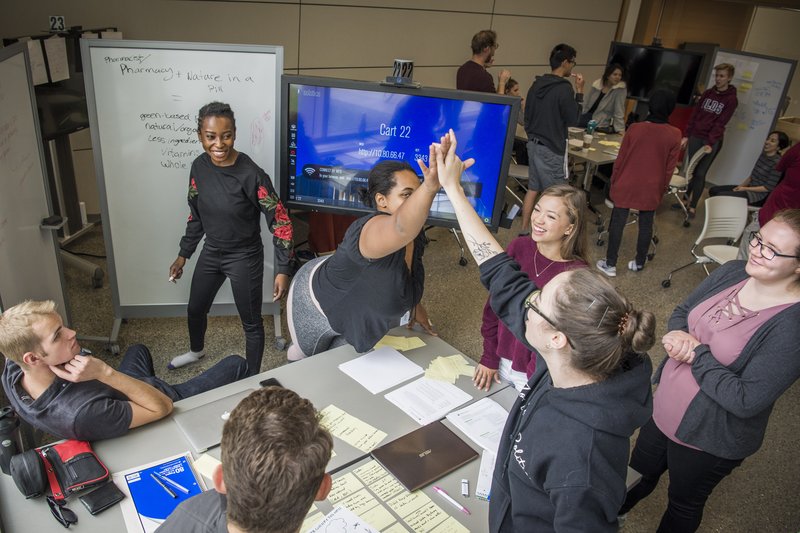
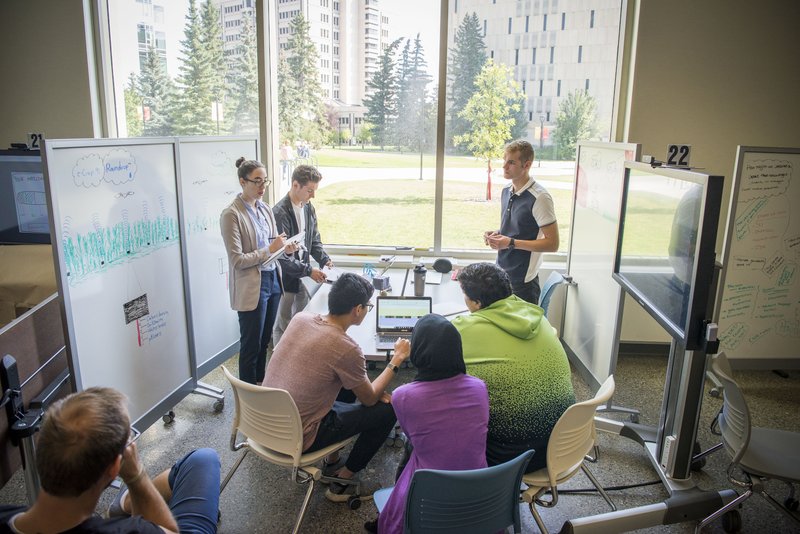
Inquiry-Based Learning: Undergraduate Pedagogy
Collaborative research about undergraduate students' experiences in a student-led, inquiry-based course — a one-of-a-kind multidisciplinary course where students addressed a global challenge through collaborative design.
-
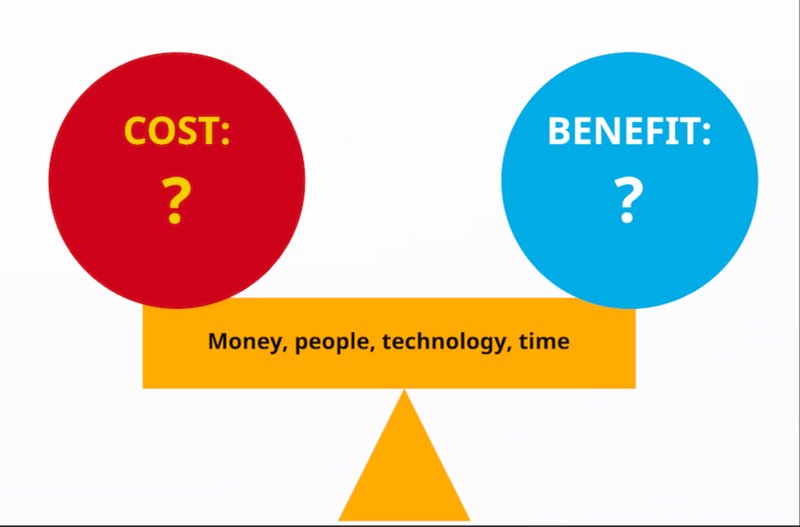
Estimating the Dollar Value of Big Data Analytics in Healthcare
Invited to join a team working on transitioning Canada's disease classification system from ICD-9 to ICD-11. I gathered and analyzed data and developed a cost-benefit model for the transition with the guidance of health economist Dr. Mingshan Lu.
-
Speakeasy: Community-Building Event Series to Address Global Challenges
Speakeasy was a campus-and-community event series in Calgary I co-created and co-organized, hosting public conversations on themes including "Difficult Conversations to Address Global Challenges," "Intersection of Indigenous Knowledge and Creative Practice," "How Big Ideas Become a Reality," and "How Experiences of Failure Can Foster Creativity and Innovation."
News & Events
Where to find me
-
Research-Creation Residency | Domestic Data Streamers
I'm joining the Domestic Data Streamers crew in Barcelona for hands-on research and design. I'll explore ways to show and input data to represent personal identities through critical discussions, and making handheld prototypes.
-
Sommet sur la diplomatie scientifique | Université de Montréal
UdeM, McGill and UCalgary have joined efforts with GESDA and the Swiss Embassy to Canada to convene a summit on science diplomacy.
-
IT University Copenhagen
Participating in a writing workshop with Vasiliki Tsaknaki and visitng the collective at the ETHOS lab.
-
CHI 2026: Craft-Based Data Physicalization Workshop
We'll explore crafting as a way to think about visualizing gender data in a non-binary way. Here's our workshop paper: "Collaborative Crafting to Visualize Non-Binary Gender Identities".
-
Dagstuhl Seminar: From Psychology Enabled Visualization to Visualization Enabled Psychology
Returning to Dagstuhl for interdisciplinary explorations of psychology and information visualization — organized by Rita Borgo (King's College London), Min Chen (University of Oxford), David S. Ebert (University of Oklahoma), Brian D. Fisher (Simon Fraser University), and Alvitta Ottley (Washington University in St. Louis).
Show earlier news & eventsShow fewer
-
IEEE VIS 2025 Conference
Participating in the Input Visualization Workshop on how researchers and designers can better understand people's socially-oriented experiences with visual information through collaborative data input.
-
Halfway to the Future Symposium
I co-presented our paper "The Inbetweeny Collective: Reflexive Dialogues on the Liminality of Researchers' Lived Experiences". I had the pleasure of being part of an exciting panel discussion headed by Kia Höök and Paul Dourish about liminal, embodied and soma aesthetic research approaches amidst new and old ways of knowing in human-computer interaction (HCI).
-
VISions of the Future Workshop at IEEE VIS
VISions of the Future was a thought-provoking gathering with many new questions and possibilities to consider in my work. Starting from Neha Kumar's talk about post-growth in HCI, we discussed sustainability across diverse communities and data practices within visualization, physicalization, and HCI. We plan to continue this community-of-practice — stay tuned!
-
Best Paper Award at CHI 2024
We got a Best Paper award at CHI! "From Exploration to End of Life: Unpacking Sustainability in Physicalization Practices." Let's continue to think about, discuss, and action sustainable practices across disciplines and domains in meaningful collaborations.
-
Dagstuhl Seminar: Reflections on Pandemic Visualizations
I spent a week at Dagstuhl with researchers and physicians reflecting on what we learned making and sharing COVID-19 data visualizations with governments and the public.
-
Talk: Community–Data Interaction
Invited talk at the giCentre, City, University of London.
-
Information+ Conference
At the Information+ Conference on interdisciplinary practices in information design & visualization, I presented our work on using data visualization as a method for public engagement, and connected with our European colleagues in person.
-
Talk: Community–Data Interaction
Hosted by the Human Data Interaction Lab at the IT University of Copenhagen.
-
IEEE VIS Conference: Visualization & Visual Analytics
Invited to present our paper "Embracing Disciplinary Diversity in Visualization" about cross-disciplinary collaboration and celebrating disciplinary diversity in data visualization practice and research.
Publications
Selected publications
- Reflections on Visualizing the COVID-19 Pandemic for the PublicNew IEEE Computer Graphics & Applications · 2026
- Challenges and Opportunities in Data Visualization Education: A Call to Action IEEE Transactions on Visualization & Computer Graphics · 2024
- From Exploration to End of Life: Unpacking Sustainability in Physicalization PracticesBest Paper Award ACM CHI Conference on Human Factors in Computing Systems · 2024
- "Wound Up in a Pandemic": A Community-Built Data Physicalization on Trust in COVID-19 Information Sources IEEE VIS (alt.vis) · 2022
- Embracing Disciplinary Diversity in Visualization IEEE Computer Graphics & Applications · 2023